Burndown Charts
The progress of the team is monitored using a burndown chart, one of the best project visibility tools, to ensure a project is progressing smoothly. The burndown chart provides a day-by-day measure of the amount of work that remains in a given release.
Viewing the burndown chart
You can show or hide the burndown chart by first selecting a release, and then click the Chart button in the workspace toolbar. You can also add a burndown chart gadget to a dashboard.
Burndown chart data
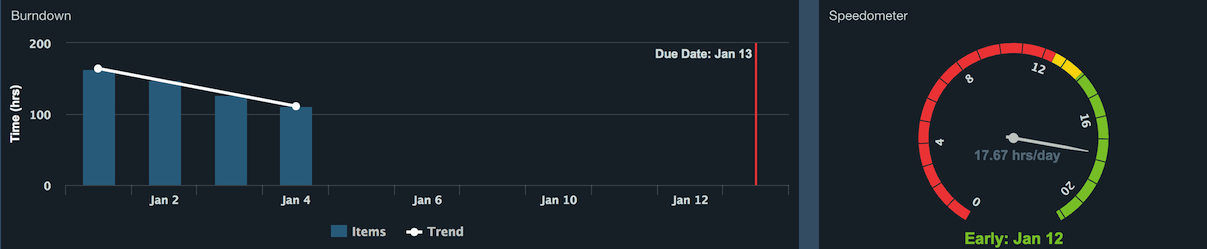
Burndown charts calculate effectively how much time is remaining in your sprint and if you will ship on time within the required velocity, or late.
Axosoft calculates velocity based on the difference between the work remaining for all items in the release when they were added, and the current work remaining. This is the difference between the y-value of the burndown chart on the start date and current date, divided by the number of days.
The remaining estimate, or the amount of time presented per day for items is decreased typically in one of two ways: by adding work logs to items to show work done, and by completing items which updates their remaining estimate to zero.
Tip: If you do not have a workflow step action when an item is completed to set its Remaining Estimate field to zero, we recommend adding this option to update your burndown chart. This can help you still track items should your team members prefer not to enter work logs.
Release due dates are tracked against velocity when determining a projected ship date to display on the Speedometer. If the ship date is on time or earlier than the due date, meeting required velocity, it will display in green. If your release is running behind, it will be red with a warning indicating that it is late.
Note: In earlier versions of Axosoft, the Speedometer was called Projected Ship Date.
Scope change
The burndown and velocity calculation is smart enough to know when things are constantly changing and you still need accurate projections. This is why it accommodates for scope change in the ways explained below.
Note: When items are added or removed from a release, the burndown will update all prior days to the change taking place to show accurate data for the past. Velocity is unaffected.
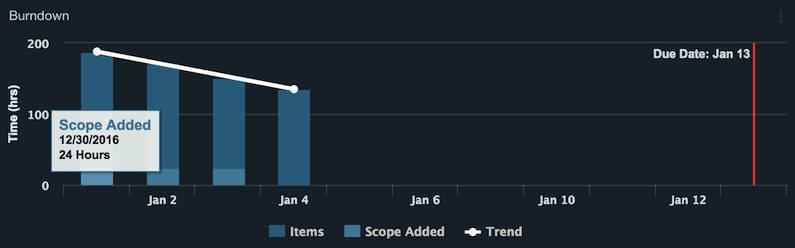
Adding Work to a Release
This is your Scope Added. During the sprint, if new items are assigned to the release, they will appear as this series.
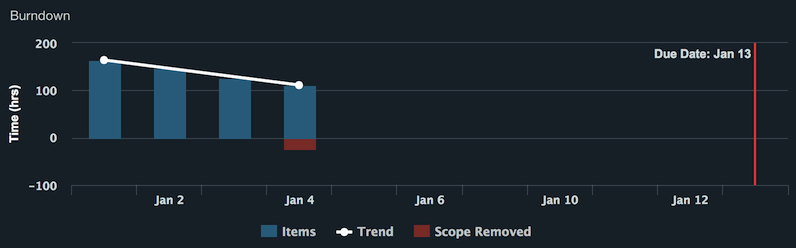
Removing items from a release
This is your Scope Removed. The opposite of Scope Added, removing items from a release will show as a negative series starting on the date the item is removed.
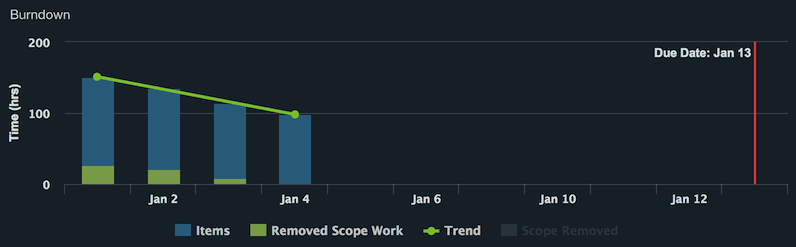
Removing work from a release
This is your Removed Scope Work. If items are removed from a release which already have associated work logs, a new series will be created to show the amount of work done and now not in the selected release.
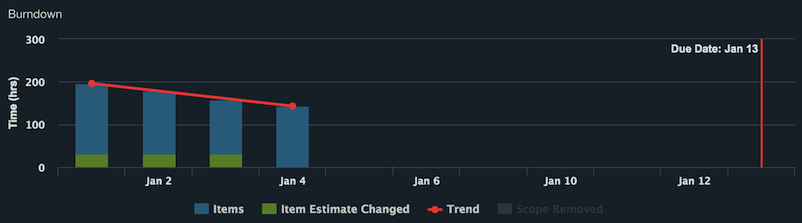
Re-estimate of items
This is your Items Estimate Changed. When adding Work Logs, if the user decides the item will take longer than expected, they will update the field for Remaining Estimate and a new series will be created to show the new work.
Tip: Each series explained can be toggled on or off on your burndown from the legend.
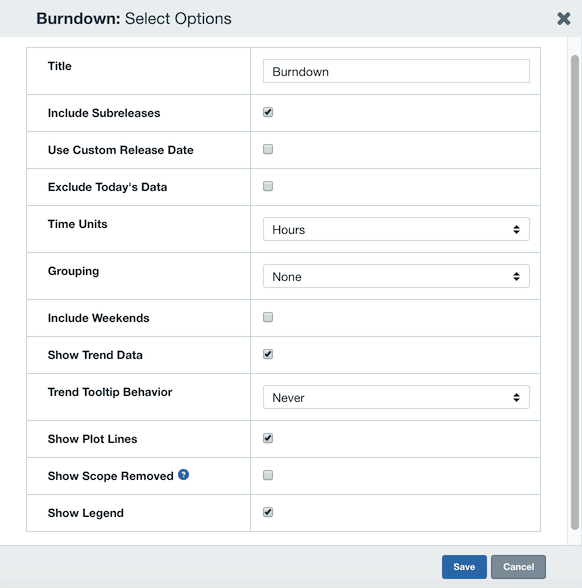
Modifying burndown charts
You can edit settings for a release's burndown chart by hovering over the burndown chart and clicking the ellipsis icon that appears in the upper right. A variety of options are available to change, including time units, weekend work, including subrelease data, show scope removed, and more.