Report Manager
Reports in Axosoft consist of master reports and report shortcuts. Master reports are the base reports that define the type and layout of the report. Master reports do not filter the data in any way. When you design a custom report, you actually create a master report. Report shortcuts let you define the filtering and sorting for the master reports. Once you've created a master report, you can create any number of report shortcuts based on it, with different filtering and sorting criteria. Report shortcuts are the report options that are listed in the Print icon dropdown on the workspace toolbar in Axosoft, and they are the viewable and printable reports. This model helps when you have different users who want to view the same report, just filtered slightly differently for their own needs.
Using the Report Manager
To edit and create custom reports, download the Report Manager and connect to your database.
Important: If you are an Axosoft hosted subscriber, you will need to enable Remote Server to utilize the Report Manager. Please email success@axosoft.com for more information.
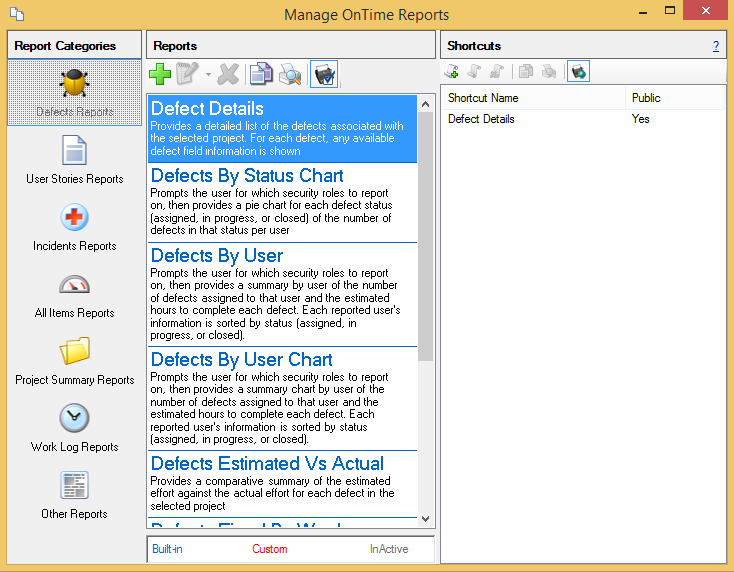
In the Reports column, built-in reports are listed in blue, custom reports are listed in red, and inactive reports are listed in gray. A legend is provided at the bottom of the screen.
At any time you want to preview a master report or report shortcut, you can select it from the list and click the Preview (magnifying glass on printer) button on the toolbar. Previewing a master report will print the report without filtering or sorting the data. Remember that master reports do not contain any filtering definition.
You may copy a custom master report or any report shortcut by selecting it from the list and clicking the Copy button in the toolbar.
Note: If you copy a built-in master report, certain filtering criteria may no longer be applied to any shortcuts of the copy. For example, running the built-in report “Defects By User” will ask you to select from a list of security roles; running a copy of this report will not ask for that information. This is a limitation of the current end-user reporting implementation in Axosoft.
Creating custom reports
To create a new custom report, first select the category or type of report you want to create. The available options, listed under the Report Categories column are:
- Defects Reports
- Features Reports
- Tasks Reports
- Incident Reports
- All Items Reports
- Project Summary Reports
- Work Log Reports
The first four types are reports that run against a specific predefined stored procedure which returns all the data necessary to create that type of report. This is the same stored procedure that the built-in reports of that type are created against. The Other Reports category displays legacy custom reports but cannot be created or modified.
Tip: An easy way to get started with reports is to copy a built-in report that is close to the report you'd like to create.
Once you've selected the report type, click the Create a new report button in the Report Manager toolbar.
Report Designer
The Report Designer tool in the Report Manager is where you create your custom report.
Report layout
The report area is the area in the center of the Report Designer window. The reporting area consists, by default, of a Page Header section, Detail section, and Page Footer section. The page header and footer sections are printed at the top and bottom of every page. This is where you place page numbers, or print date, or any information that should be repeated on every page. The detail section is where the printing of the data most likely occurs. The detail section is printed for every record, thus placing any field or control into this section will cause them to be printed once for every record in your data source.
You can also add additional sections by right-clicking the reporting area, and selecting the Insert menu option on the context menu. The available options are Report Header/Footer and Group Header/Footer. The report header and footer sections are printed at the beginning and end of your report. This is where you place a report title, or report summary that should only be printed once for the report. Inserting a group header and footer allows you to group data by a certain field in your data source. Once you insert the group, click the Group Header section and in its properties panel you can specify what field to group by.
Fields
The Fields panel lists all the fields from the data source that are available for you to use on the report. Depending on what type of report you are creating, the list will be different. To use a field from the data source in your report, simply click and drag the field you want onto the report. For most reports you would place the fields in the details section, but you may place the fields in any of the sections of the report.
Tools
The toolbar on the left side of the designer window contains a list of objects (tools) that you can use on your report. To use any object in the report, simply click the object on the toolbar then draw it on the report area.
- Pointer — the default tool and is used for working with objects on the report area.
- Label — used for printing simple text. A label can be connected to a field, or just display any other text. A label supports simple formatting as well as rotating the text using the Angle property.
- Text Box — used for printing text that needs to be formatted. A text box can be connected to a field, or just display any other text just like a label. The text box support more complex formatting than the label, and does not support rotating the text. Using the text box's OutputFormat property you can specify different formatting for the values of the text box. You can also use the text box for performing summaries of fields in the data source.
- Rich Text Box — used for printing RTF or HTML text. A rich text box can be connected to a field, or just display custom text.
- Check Box — used for placing a check box on the report. A check box can be connected to a field, or display some other text.
- Shape — used for drawing rectangles or ellipses. Use the Style property of the shape to specify what it should draw.
- Line — used for drawing a straight line.
- Page Break — used for manually inserting a page break in the report.
- Picture — used for inserting an image in the report.
- Chart — used for inserting a graph in the report.
Formatting text
To format any field or text placed on the report, simply select it on the report and use the formatting buttons on the toolbar. Formatting options include changing the font, bold, italic, and underline, and justification of the text.
Editing custom reports
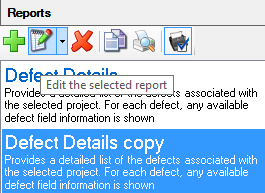
To edit an existing custom report, select the custom master report from the list and click the Edit selected report button from the toolbar.
Default reports will display in blue and are read-only. To modify a built-in report, first create a copy of the report which will display in black and allow you to edit the report.
The Report Designer window will be displayed, allowing you to modify the master report. You may modify any aspect of the report (layout, scripts, etc.). Once you've updated the report, select File Save to save the changes, and close the window.
Deleting custom reports
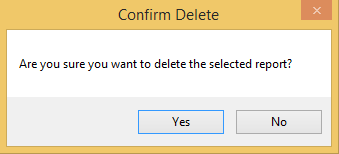
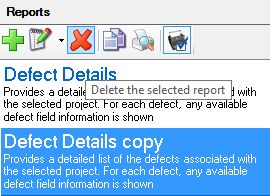
To delete an existing custom report, select the custom master report from the list and click the Delete button on the toolbar. A window will pop up asking you to confirm the deletion of the master report.
Once you click Yes, the master report will be deleted along with all its associated report shortcuts.